
Void analysis from Placer.ai provides a data-driven tool for matching available retail spaces with potential brands/tenants.
Finding a good fit
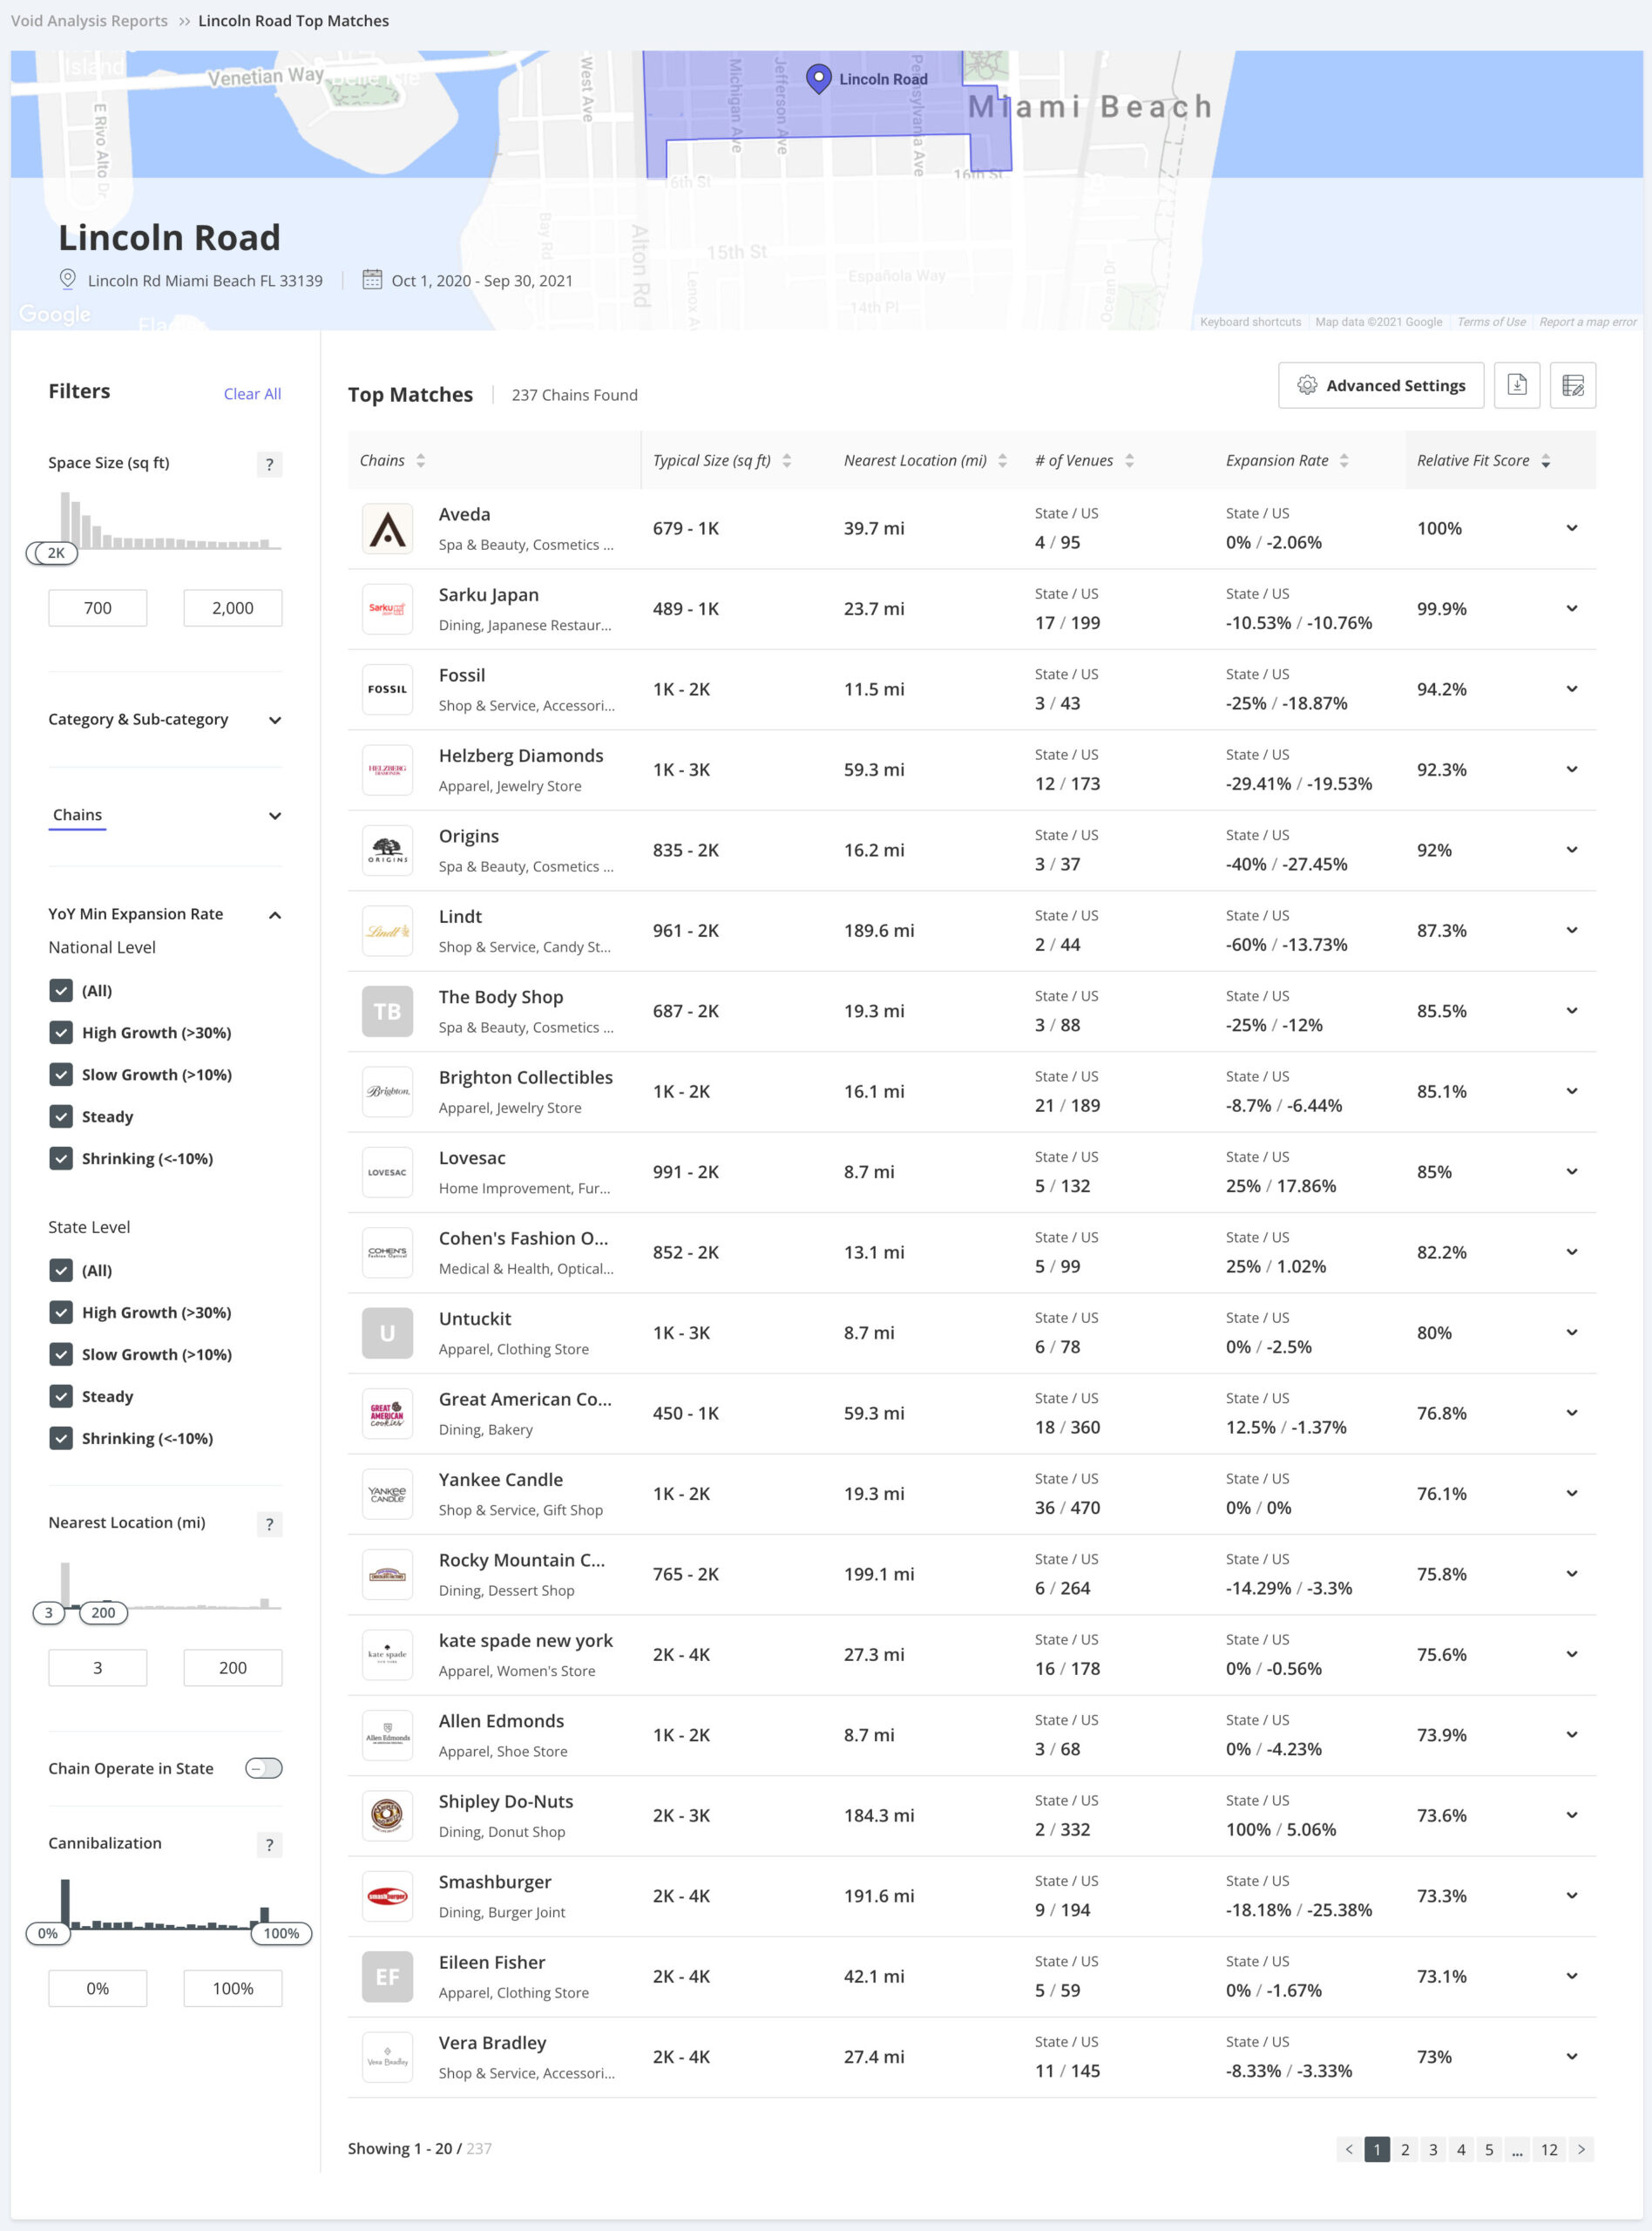
Void Analysis Reports
Reports can be generated based on square footage, local competition and other factors.
Matching Tools
Summary reports for brands.
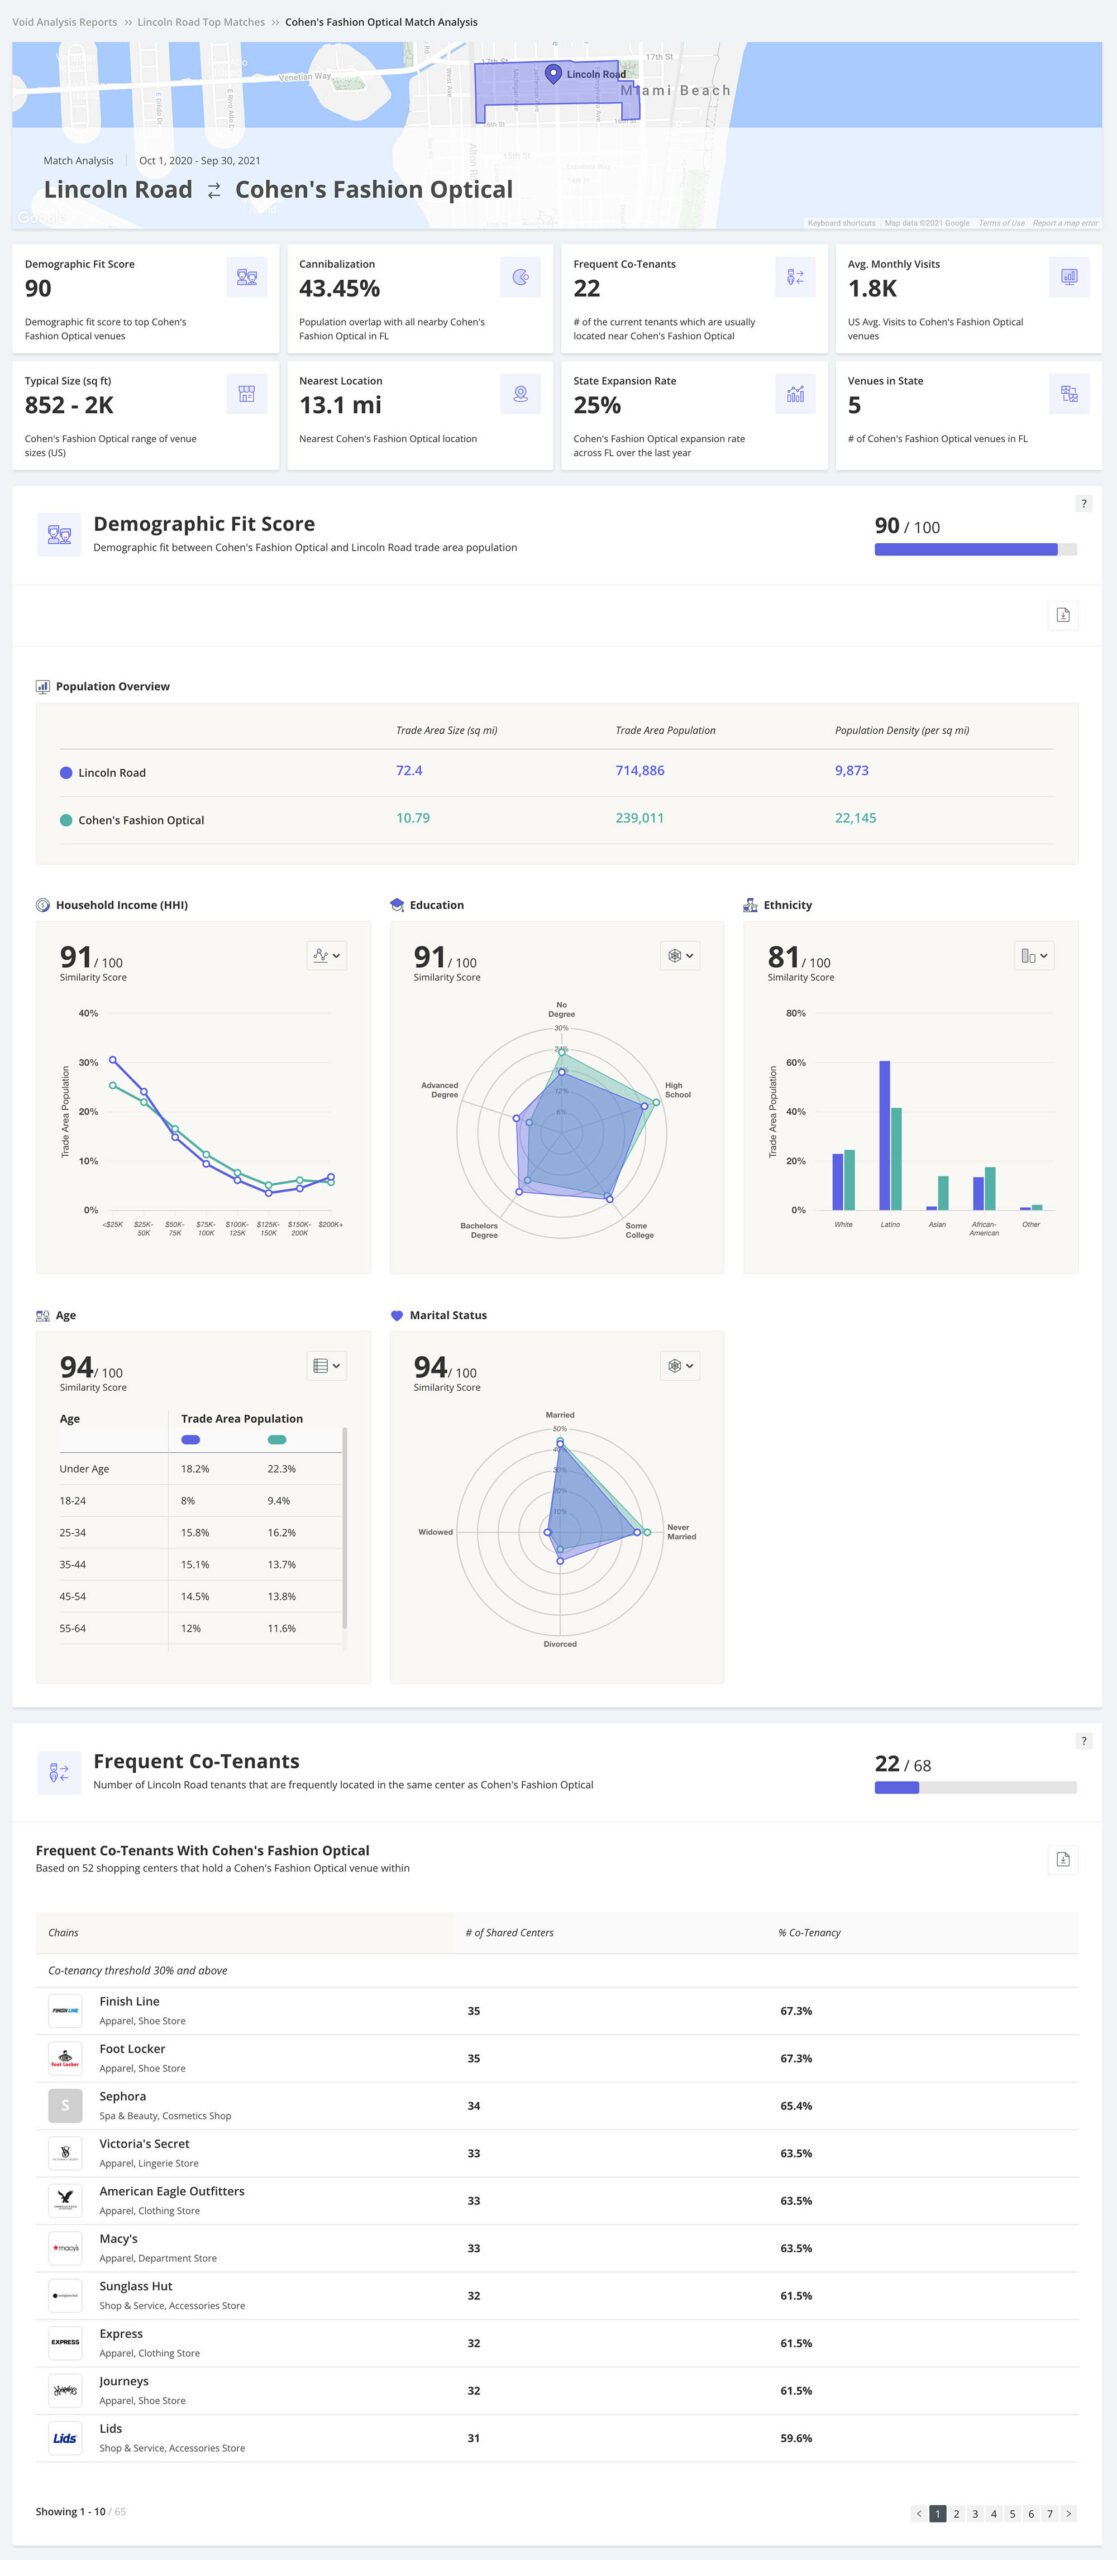
Deep Dive
Detailed reports on fit including competition, demographics and other data points.
Void Analysis – Relative Fit Score Overview
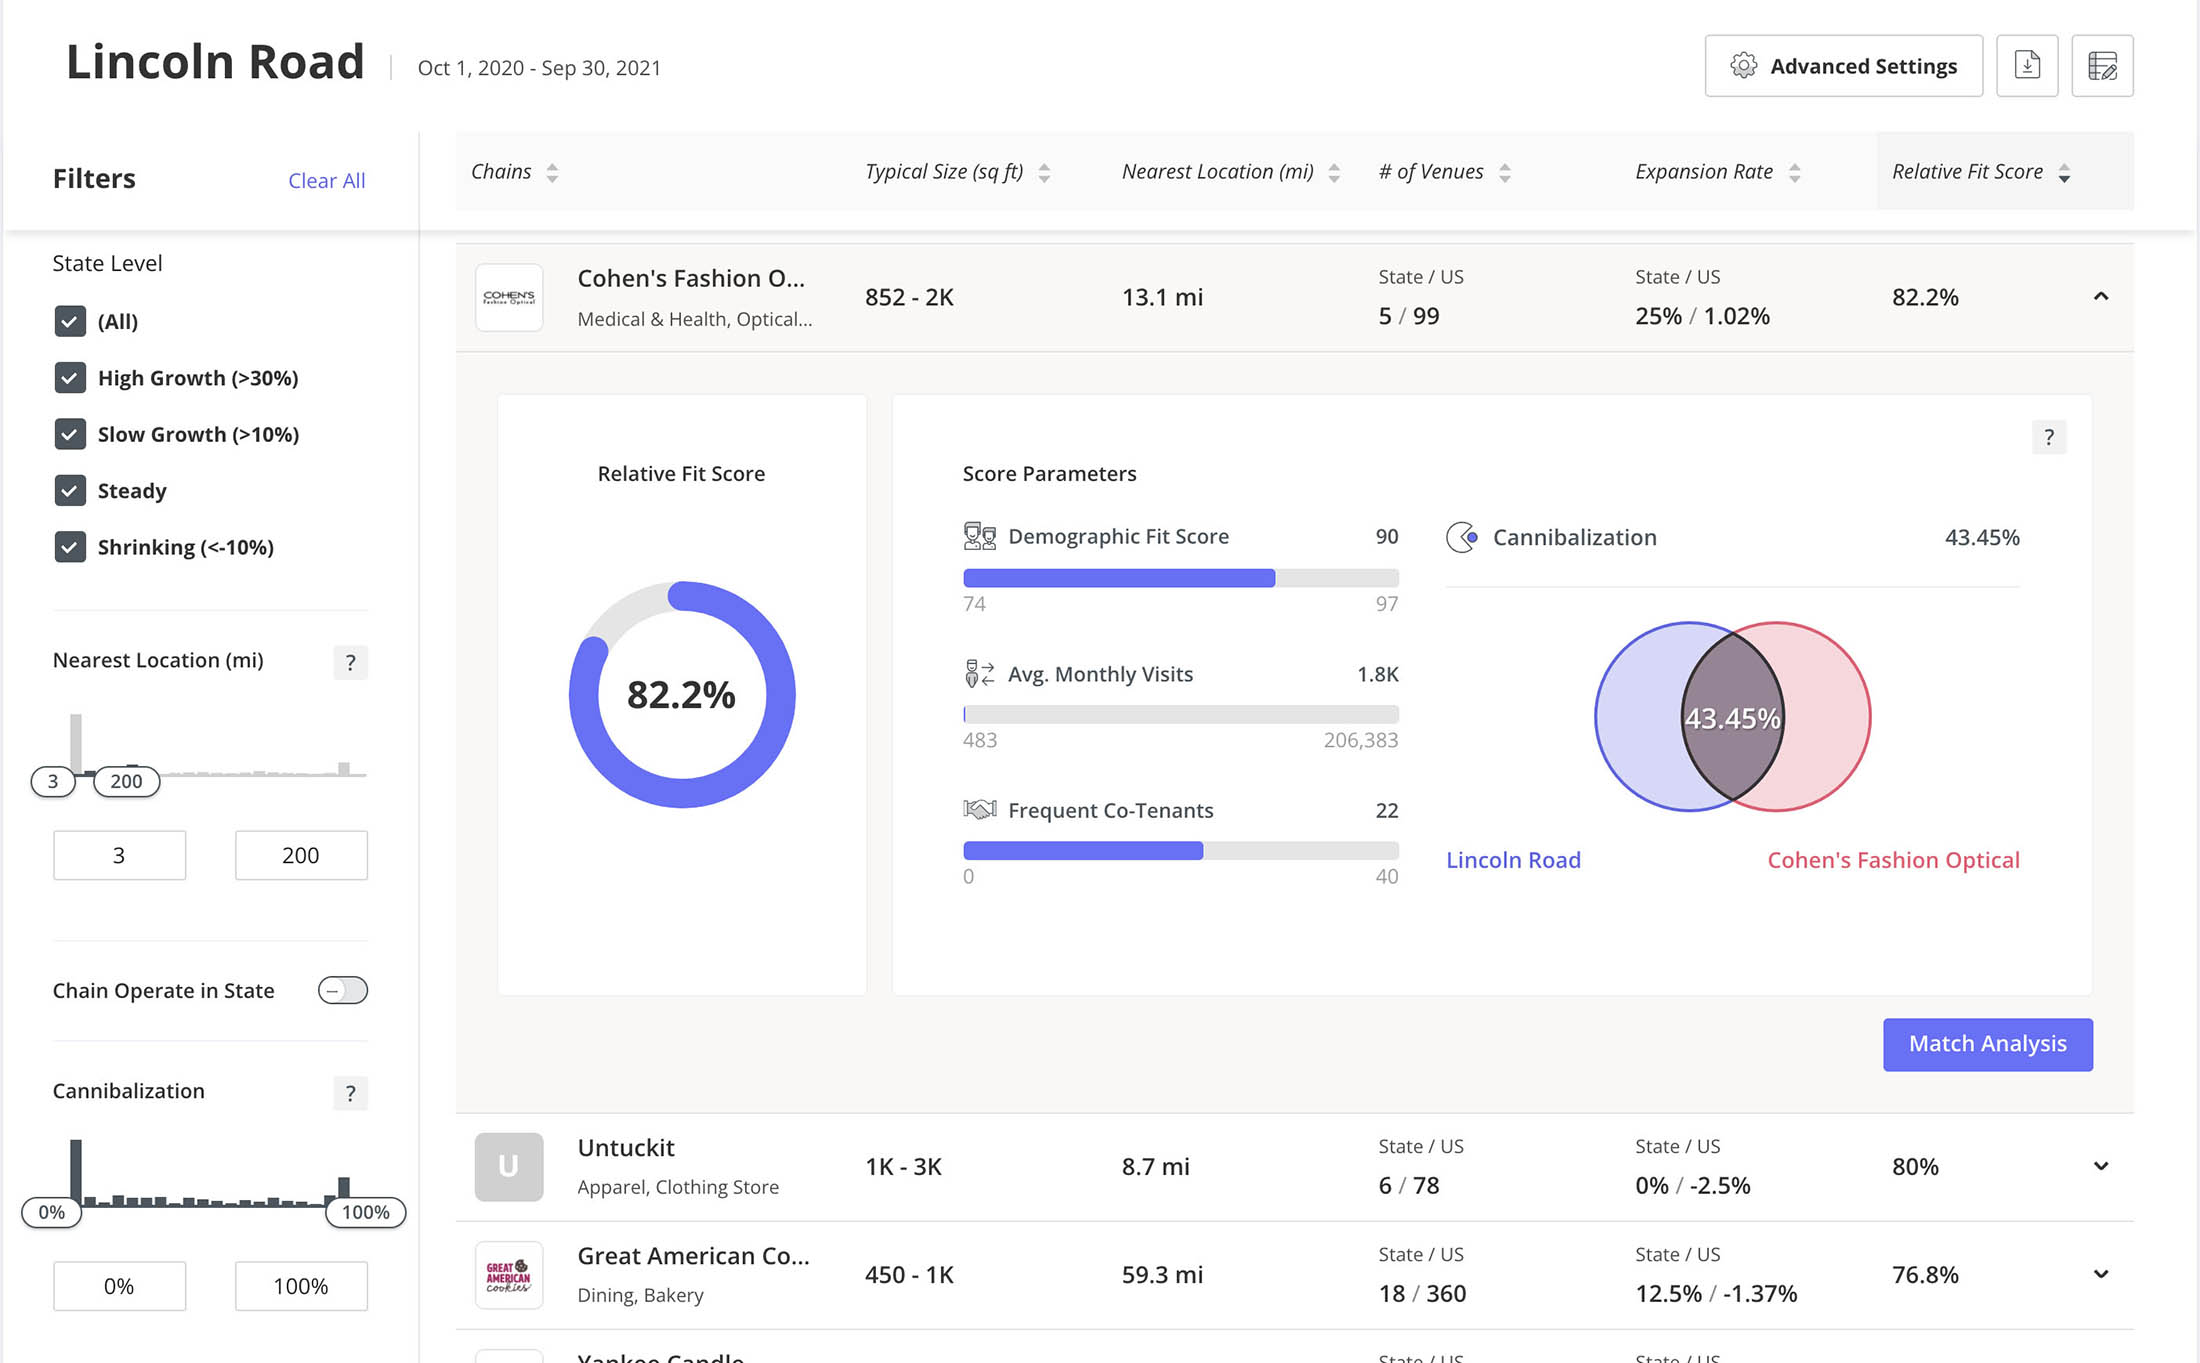
The Relative Fit Score indicates the overall compatibility of a potential tenant with the site analyzed based on multiple weighted criteria and the filters selected. The Relative Fit Score is calculated using four distinct parameters that measure key variables and property attributes:
Demographic Fit Score – The Demographic Fit Score (DFS) measures how well a prospective tenant fits the demographic profile of the property. By default the score is calculated using 3 demographic attributes: household income, education and ethnicity, which can be adjusted . The DFS is an average of the score given to each of these attributes, see Match Analysis for more details. The scale min and max values represent the values of the prospective chains with the lowest and highest DFS score out of all the chains in the list.
Average Monthly Foot Traffic – Average monthly FT shows the average number of visits to a single chain location, nationwide. Average monthly foot traffic is based on the estimated number of visits as measured by Placer.ai. The scale min and max values represent the values of the prospective chains with the lowest and highest FT score out of all the chains in the list.
Frequent Co-Tenants – Frequent Co-Tenants shows the number of a property’s existing tenants that are typically situated near a chain locations. Placer.ai looks at a chain’s locations, and within these locations our systems check where the property’s tenants are also situated. These shared locations are counted and determine a score. The scale min and max values represent the values of the chains with the lowest and highest Frequent Co-Tenants score out of all the prospective chains in the list. By default, Placer.ai requires that a tenant is represented in over 30% of a chain’s total locations to be counted as a “frequent co-tenant.”
Cannibalization – The prospects of cannibalization strongly hint at the prospective chain’s customer churn among existing stores, should a new chain store is opened at the given property. In the diagram, the shared zone between the two circles represents the potential population overlap between the (i) property and a (ii) chain’s locations within 50 miles. We calculate this overlap as a percentage. 100% implies full cannibalization risk while 0% implies no cannibalization risk.
The population data used to calculate these variables is based on: U.S. Census (2017), weighted centroid allocation Type, and 70% of traffic volume within 50 miles of a given property.